Decision trees are a fundamental method in machine learning, particularly useful for both classification and regression tasks. They’re based on a simple, yet powerful idea: using a tree-like model of decisions to go from observations about an item to conclusions about its target value.
In this article, I will guide you with the basic foundations of decision trees. This guide sets the stage to understand what classification and regression trees are, and how they work. We’ll start with a conceptual understanding of decision trees, types, building blocks, and then conclude with applications.
The Basic Concepts of Decision Trees
A decision tree is a popular machine learning algorithm used for both classification and regression tasks. It’s a tree-like model of decisions and their possible consequences. A decision tree consists of three types of nodes:
- Decision Node: typically represented by squares.
- Chance Nodes: typically represented by circles.
- End Nodes: Typically represented by triangles.
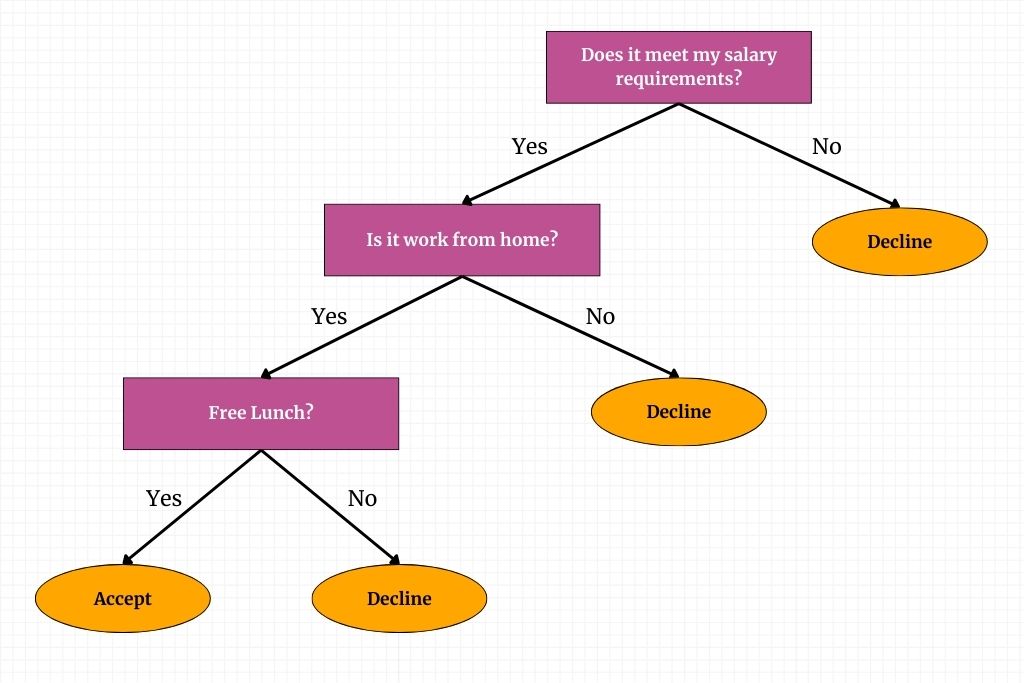
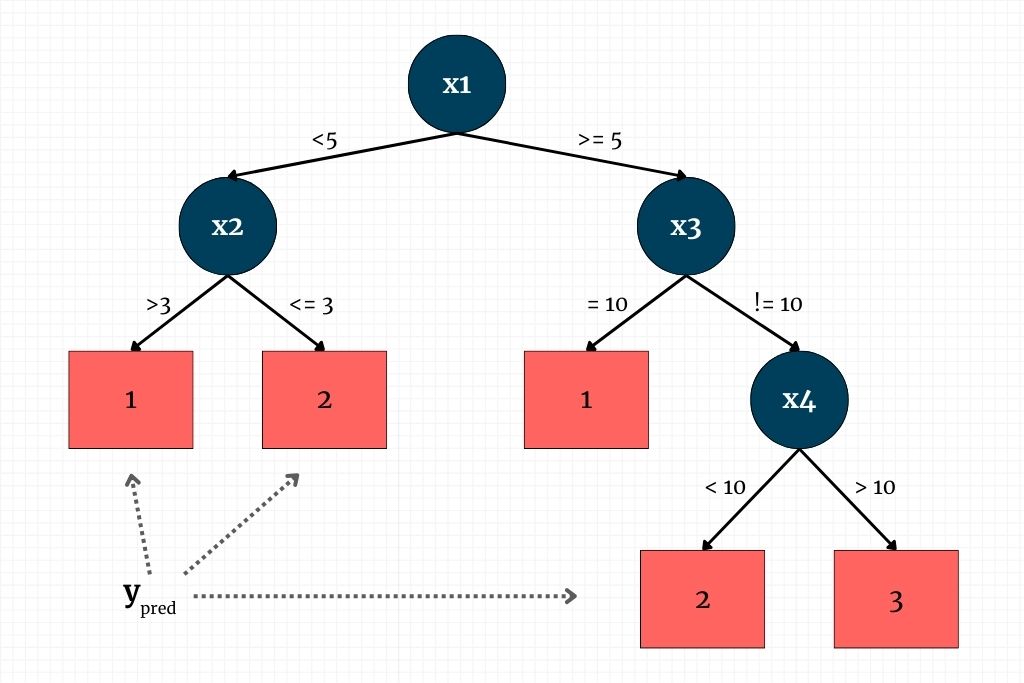
A decision tree resembles a flowchart, where every internal node signifies a test or evaluation of an attribute (for instance, checking the outcome of a coin toss is heads or tails). Each pathway emerging from these nodes denotes the possible results of the test, leading to further nodes or to the final decisions, which are represented by leaf nodes.
These leaf nodes hold the classification or decision derived after analyzing all relevant attributes. The journey from the tree’s root to its leaves encapsulates the set of rules or criteria used for making classifications or decisions.
Building Blocks of a Decision Tree
The construction of a decision tree involves several building blocks that enable it to efficiently categorize data or make predictions. Understanding these components is essential to grasp how decision trees work and how they can be applied to solve various problems.
Elements of a Decision Tree
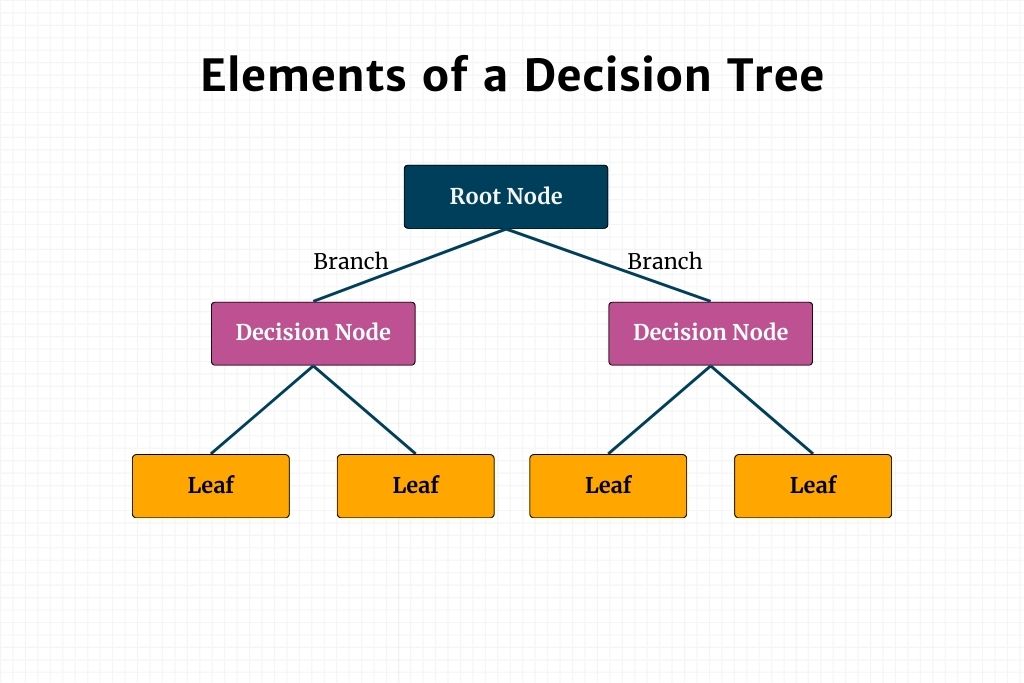
Decision trees have several key components that work together to make decisions based on their input data. These include the following:
- Root Node: This the topmost node of the tree where the decision-making process starts. It represents the whole dataset, which then splits into two or more homogeneous sets.
- Decision Node: After the root node, the tree contains several decision nodes. These nodes test a specific attribute of the data and branch out based on the outcome of the test. Each decision node also represents a decision rule, leading to further splitting, or eventually to the lead node.
- Leaf Node/Terminal Node: The lead node represents the final output of the decision process. In a classification tree, the lead node may contain the class or label, while in regression trees, the leaf node may provide the predicted value. Finally, lead nodes are terminal points – that is, they don’t split further.
- Splitting: This is the process of dividing a node into two or more sub-nodes, based on certain conditions or attributes. Splitting is done using various algorithms to determine which feature (or attribute) best separates the data into different branches of the tree.
- Branches (sub-Tree): A subsection of an entire tree is called a branch or sub-tree. They represent the flow from one question or decision to the next, ultimately leading to a leaf node. Each branch corresponds to a possible value or range of values of the tested attribute.
- Pruning: This is the process of reducing the size of the tree to prevent overfitting. It involves cutting down parts of the tree (such as branches or nodes) that are not significant in decision-making. Pruning can be pre-pruning (stopping the tree before it grows fully) or post-pruning (removing sections of a fully grown tree).
- Splitting Criteria: These are the techniques used to choose the attribute that best splits the data at each step. Common methods include Gini impurity, information gain, or variance reduction for regression trees.
Decision Rules of a Decision Tree
Decision rules are the criteria or condition set at each node that determine how the data will be split. These rules are crucial in guiding the path from the root node to the leaf node. Here’s a closer look at some of the most popular decision rules for decision trees.
- If-Then-Else Structure: The most common form of a decision rule in a tree is an if-then-else statement. For instance, “if [feature] is less than [value], then follow the left branch, else follow the right branch.” This is a simple, yet effective way to guide the decision-making process.
- Feature-Based Values: Decision rules can also be based on the values of the features in the dataset. For numerical features, it often involves comparisons (e.g. greater than, less than). For categorical features, this may involve checking for equality or membership in a subset.
- Threshold Determination: For continuous numerical variables, decision rules use thresholds to split the data. For example, a rule can be “if age > 30, then go to the left sub-node, else, go to the right sub-node”. Determining these thresholds depends on the dataset and is crucial for training a decision tree.
- Information Gain & Purity: In classification trees, rules are formed based on maximizing information gain or purity increase. Information gain is often computed using metrics like Gini impurity or entropy. The rule chosen at each step is the one that most effectively purifies the child nodes – i.e., makes them as homogeneous as possible.
- Variance Reduction: In regression trees, decision rules are based on reducing the variance within each node. The split at each node is chosen to minimize the variance in the target variable among the groups formed by the split.
- Greedy Nature: Decision tree algorithms typically use a greedy approach to form these rules. They make the best split at each node without considering the impact on future splits. This can sometimes lead to suboptimal trees, but it keeps the computation manageable.
- Hierarchical Structure: The rules at each node depend on the rules of its parent nodes. This hierarchical structure means that the path from the root to a leaf node defines a unique combination of rules applicable to the instances classified by that leaf.
These are some of the most popular decision rules that you might encounter. There are many more like rule pruning, handling missing values, or multiway splits. The main point is that these rules are at the heart of a decision tree’s predictive capabilities. They are formulated based on the training data, with the objective of accurately splitting the dataset into groups that are as pure as possible with respect to the target variable.
Flowchart Symbols
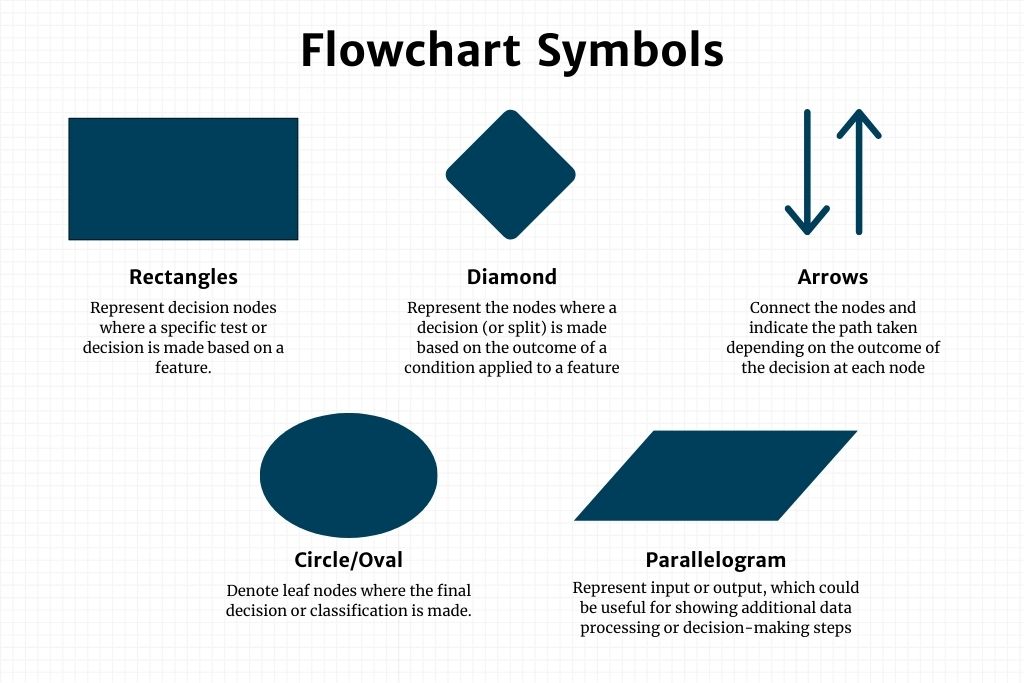
As a visual learner myself, it’s also important to interpret a decision tree. A decision tree using flowchart symbols is a visual representation where each component of the tree corresponds to a specific symbol commonly used in flowcharts.
- Rectangles (Process Boxes): In a flowchart, rectangles are used to represent processes or actions. In a decision tree, these can be used to represent decision nodes where a specific test or decision is made based on a feature.
- Diamonds (Decision Boxes): Diamonds are typically used in flowcharts for decision-making points. In the context of a decision tree, they perfectly represent the nodes where a decision (or split) is made based on the outcome of a condition applied to a feature.
- Arrows: Arrows in flow charts indicate the flow of control or the direction of the process. In decision trees, arrows are used to connect the nodes and indicate the path taken depending on the outcome of the decision at each node.
- Ovals (Terminators): Ovals are often used in flowcharts to represent the start and end points. In decision trees, ovals can be used to denote leaf nodes where the final decision or classification is made.
- Parallelograms (Input/Output): While not always used in decision trees, parallelograms can represent input or output, which could be useful for showing additional data processing or decision-making steps outside of the standard tree structure.
- Labels: Alongside the symbols, labels are crucial in decision trees. They indicate the condition or feature being tested at each decision node (diamond), the decision made at each leaf node (oval), and sometimes the outcome leading from one node to the next (along the arrows).
Types of Decision Trees: Classification & Regression Trees
Classification trees and regression trees are two types of decision trees used in machine learning, each suited for different kinds of problems.
Classification Trees
Classification trees are a subtype of decision trees designed for categorizing instances into discrete classes. They are widely used in machine learning tasks where the outcome variable is categorical, such as predicting the genre of movie to watch next, or determining the type of cancer the patient has.
The process in classification trees begins at the root node, which contains the whole dataset. Based on a specific criterion, this dataset is split into two or more homogeneous sets. The choice of how to split the data at each node is determined by measures like Gini impurity, entropy (information gain), or chi-square.
The goal is to maximize homogeneity within each node – meaning, each node after the split should aim to contain instances of as few different classes as possible. This process of splitting based on the best criterion continues recursively for each new node until one of the stopping criteria is met. These criteria might include reaching a maximum tree depth, achieving a minimum node purity, or having fewer than a minimum number of points in a node.
The process ends when further splitting is no longer possible or beneficial, leaving us with leaf nodes. Each leaf node represents a class label that is assigned based on the majority class of instances within that node.
Advantages of Classification Trees:
- Interpretability: Like all decision trees, classification trees are easy to understand and interpret, even for individuals with no background in statistics.
- Handling of Non-Linear Data: They can capture non-linear relationships between features without requiring transformation.
- Feature Importance: They naturally rank features by importance, providing insights into which variables are most influential in predicting the outcome.
Regression Trees
Regression trees, on the other hand, are a type of decision tree designed for continuous outcome variables. Unlike classification trees, which predict categorical outcomes, regression trees predict numeric values. They are used in various domains such as finance for predicting stock prices, real estate for estimating house values, and in any scenario where the goal is to forecast numerical outcomes based on input variables.
For regression trees, the process also begins at the root node, representing the entire dataset. This dataset is then split recursively based on a specific criterion that aims to reduce the variance within each node.
Regression trees often use measures like mean-squared error (MSE) or mean-absolute error (MAE) across split nodes to decide on the best split. The objective is to find the split that results in the greatest reduction in variance for the target variable at each node.
This splitting process continues until one of the predetermined stopping criteria is met, such as reaching a maximum depth of the tree, a minimum number of samples in a node, or a minimum reduction in variance.
Advantages of Regression Trees
- Interpretability: Regression trees offer a clear visualization of how decisions are made, making the model’s predictions easy to understand.
- Non-linearity and Interaction Effects: They can model non-linear relationships and interactions between variables without needing to manually specify or transform variables.
- Handling of Different Types of Data: Regression trees can handle both numerical and categorical variables and are not influenced by outliers in the target variable.
When to Use & Not to Use Decision Trees
Decision trees are a versatile and powerful tool in machine learning, but like any tool, they have situations where they are particularly effective and others where alternative methods might be better suited.
When to Use Decision Trees
- When interpretability is key: Decision trees are highly interpretable. This means they are ideal when you need to understand and explain the reason behind the predictions, such as business or healthcare decisions.
- When handling both numerical and categorical data: Decision trees can manage both types of data without extensive pre-processing like one-hot encoding or normalization.
- Non-linear relationships: Decision trees can also capture complex, non-linear relationships between features and the target variable, without requiring variable transformations.
- Dealing with high-dimensional data: They can also handle high-dimensional spaces and large numbers of features very well.
- Flexibility for different output types: You can use classification and regression trees for both categorical and continuous numerical output variables.
When Not to Use Decision Trees
- Overfitting Risk: Decision trees can easily overfit, especially with noisy or very large datasets. Pruning and setting a maximum depth can help mitigate this.
- Unstable Nature: Small changes in the data can lead to a completely different tree structure. This instability can be reduced with ensemble methods like Random Forests.
- Linear Relationships: For data with simple linear relationships, linear models might perform better and more efficiently.
- Highly Imbalanced Data: Decision trees might become biased towards the dominant class. Techniques like balancing the dataset or using specific evaluation metrics are needed.
- Complex Models: If a very complex model is needed (e.g., for image or speech recognition), more sophisticated methods like neural networks might be more appropriate.
- Computational Efficiency: For very large datasets, decision trees can become computationally expensive to train.
Decision trees are a good starting point due to their simplicity and interpretability. They’re particularly useful for exploratory analysis to get a sense of the data’s structure. However, for more complex applications or when dealing with certain types of data, more sophisticated or specialized models may be necessary.
Additionally, combining decision trees with other methods, such as in ensemble techniques like Random Forests or Gradient Boosted Trees, often yields better performance while retaining some of the interpretability of trees.
Applications & Examples of Decision Trees
Decision trees are versatile and widely used in various domains for solving real-world problems. Their simplicity and interpretability make them a popular choice for many applications. Here are some notable examples:
- Credit Risk Assessment: A financial institution can develop a decision tree model to evaluate the risk profile of loan applicants. The model uses attributes like credit score, income level, employment history, and debt-to-income ratio. Based on these attributes, the decision tree categorizes applicants into different risk categories (low, medium, high) to determine their loan eligibility and interest rates. For instance, an applicant with a credit score above 750, stable employment for over 3 years, and a low debt-to-income ratio might be classified as low risk, qualifying for lower interest rates.
- Medical Diagnosis: In a healthcare setting, a decision tree can assist in diagnosing patients with heart disease. The tree considers factors such as cholesterol levels, blood pressure, age, gender, and smoking status. Depending on the patient’s data traversing through the tree, it might conclude a high risk of heart disease if, for example, an individual over 50 has high cholesterol and high blood pressure, prompting further tests or interventions.
- Customer Segmentation for Marketing: A retail company uses decision trees to segment its customer base for targeted marketing campaigns. By analyzing customer data on past purchases, demographics, and engagement with marketing channels, the decision tree identifies distinct segments that exhibit similar shopping behaviors or preferences. A specific outcome might involve identifying a segment of customers who prefer eco-friendly products and are more responsive to email marketing, allowing the company to tailor its marketing efforts accordingly.
- Fraud Detection in Transactions: An online retail platform employs decision trees to detect potentially fraudulent transactions. By analyzing variables such as transaction size, frequency, location, and device used, the decision tree can flag transactions that deviate significantly from a user’s typical behavior. For instance, a sudden high-value transaction from a new device and location might be classified as suspicious and subject to additional verification.
- Real Estate Pricing: Real estate analysts use regression decision trees to predict the prices of homes based on features such as square footage, location, number of bedrooms, and amenities. A decision tree might determine that homes in a particular neighborhood with more than three bedrooms and recent renovations tend to sell for higher prices, providing valuable insights for sellers setting prices and buyers making offers.
- Agricultural Crop Management: Decision trees aid in deciding the optimal planting strategy for crops based on soil conditions, weather patterns, and crop yield data. A specific application could involve a decision tree recommending the best crop rotation plan or identifying the ideal time for planting and harvesting to maximize yield, given the current year’s climate model predictions.

Key Takeaways
In conclusion, the exploration of decision trees reveals a powerful and versatile tool in the field of machine learning, capable of tackling both classification and regression problems with remarkable effectiveness. The foundational elements of decision trees, from the root node to the critical decision and leaf nodes, alongside the mechanisms of splitting, pruning, and criteria selection, form a robust framework for predictive modeling.
This methodology not only facilitates the extraction of meaningful insights from complex datasets but also ensures the interpretability of the decision-making process, a valued feature in many practical applications. Whether it’s assessing credit risk, diagnosing medical conditions, segmenting customers for targeted marketing, or predicting real estate prices, decision trees offer a reliable and accessible approach for data-driven decision-making across various domains.
The specific examples provided highlight the broad applicability and potential of decision trees to deliver actionable intelligence and drive significant outcomes in business, healthcare, finance, and beyond. As we continue to navigate through an era dominated by data, the foundational principles and applications of decision trees underscore their enduring relevance and potential to harness the power of data for informed decision-making and predictive analysis.

